Designing non-toxic nanomaterials requires that we understand how those nanomaterials interact with biological systems. Systems such as you me, and all other organisms, contain a “biological soup” of chemical compounds, known as biomolecules. So the question becomes…how do nanomaterials transform once they come into contact with these biomolecules? This question has become increasingly important, especially as nanomaterials are developed for the biotechnology and medical fields.
Once a nanomaterial enters the body, typically through the bloodstream, the nanomaterial is exposed to a slew of biological matter such as proteins, cells, and minerals. Molecules from this “biological soup” will latch onto the exterior surface of the nanomaterial creating what scientists have started calling a “protein corona.” It is important to understand the protein corona because when these nanomaterials interact with biological systems such as cells, the cells first encounter the protein corona, which coats the surface of the nanomaterial. Therefore, the protein corona is a critical component of the nanomaterial and is essential in understanding how nanomaterials interact with biological systems.

Scientists have used a variety of techniques to investigate the protein corona. One interesting technique that offers some unique abilities is known as fluorescence correlation spectroscopy (FCS). FCS has the ability to track and provide information on how fluorescent objects, like many nanoparticles or proteins, interact with each other. FCS is unique because it combines two techniques, fluorescence spectroscopy and dynamic light scattering (DLS), into one. I will begin by briefly explaining these techniques.
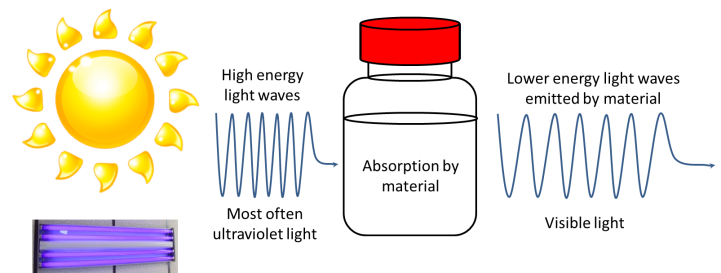
Fluorescence occurs when a material absorbs light at a certain wavelength and emits light at a longer wavelength. I refer you to Tom Kuech’s blog post on fluorescence to get a better idea. But in brief, fluorescence can be summed up in this diagram:

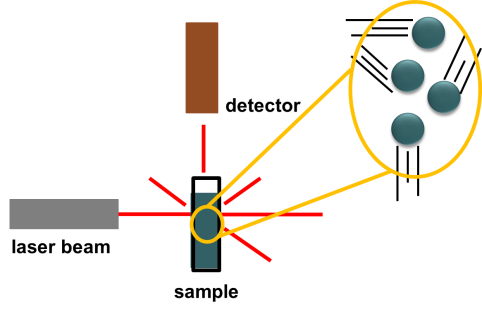
The second technique FCS uses is one that enables scientists to measure the size of particles as they float around in a liquid. These mixtures of tiny particles in liquids are called colloids. Milk is perhaps the most well-known example of a colloid. Milk contains tiny particles of fat floating around in protein-rich water. A technique that can measure the sizes of these particles is known as dynamic light scattering. Here is a diagram illustrating a typical DLS instrument setup.

First, we have a sample of small (nanometer- to micrometer-size) particles floating in a liquid to form a colloidal solution. We then shine a laser beam onto the sample. The laser beam light penetrates straight through the sample and scatters off of the particles at various angles.
Light-Scattering Note: Light scatters when it hits particles in solution and bounces off the particles at different angles. The sky is blue because particles in the atmosphere scatter blue light the most when the sun’s rays hit the particles.
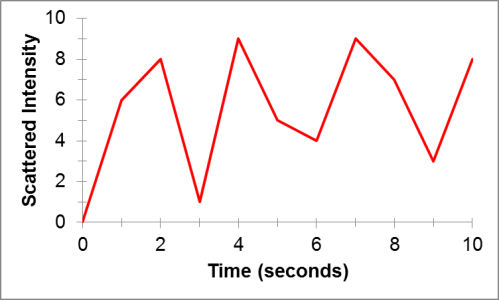
Back in the DLS instrument, a detector collects the light that is scattered by the particles in solution. But how does this help us understand anything about the particles? They scatter light, but what’s the big deal? The key is in the particles’ motion. Particles in solution will move around because they are constantly colliding with the tiny liquid molecules that surround them. This is known as Brownian motion. This phenomenon is named after Robert Brown, a botanist who observed the random and erratic motion of pollen particles floating in water. From these random particle motions, when we measure the intensity of the light that is scattered by particles in a liquid sample over time, we will get a plot that has a random pattern like this:

This plot turns out to be the key to uncovering the average size of particles in a sample of liquid. Small particles will move around more easily than big particles in solution. This means that over short times, we can track large particles more easily than small particles. Using this idea, we can perform some mathematical tricks on plots like the one above to determine the size of particles in solution that gave rise to that scattered light.
Okay, so now back to our original question. FCS combines these two techniques but how can FCS help us understand the nano-bio interface? Well, we can start with pristine nanoparticles that have not interacted with any biological material. The nanoparticles we use in this technique must be fluorescent. So, when we shine laser light of a certain color on them, they will emit light of a longer wavelength. Using FCS, we can measure their size, just as in DLS. Because the nanoparticles are fluorescent and nothing else is fluorescent in the samples I plan to investigate, the FCS instrument will only measure the size of the nanoparticles and not the size of any other biologically-derived particles floating around in the water. This is one of the key advantages of FCS—it can “ignore” non-fluorescent materials and only observe the fluorescent materials you are curious about.
Now when we expose these pristine nanoparticles to biological material, if that material sticks to those particles, the average particle size will increase. One thing we want to know is how strongly or quickly these biological molecules stick to the nanoparticles. In our experiments, the biological molecules we are using are proteins. So, we add increasing amounts of a specific type of protein, and we can monitor the size increase in the nanoparticle as the protein sticks onto the nanoparticle surface. From this, we can obtain a lot of information that will give us more insight into how nanomaterials interact with biomolecules. We hope this will provide us with crucial insights into the “protein corona” that forms around nanoparticles, and how that will impact their interactions with living organisms.
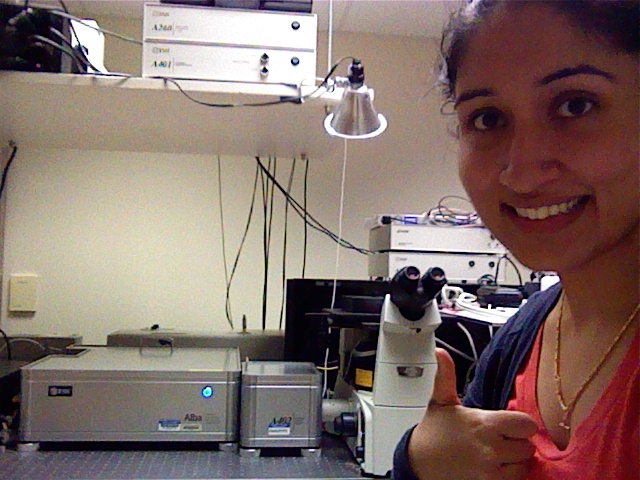
I will be using FCS to investigate nanoparticle-biomolecule interactions for my research. I’ve just started working with the FCS instrument but I hope to share updates on this endeavor in my next blog post!

Related Activities:
CD Spectrometer
Glow Up
What Is Light?
Tonic Water Hand
Spectroscope

[…] Entries Related to the Nano-Bio Interface: How I Study Nanoparticles’ Interactions with Biological Soup Spying on chameleon nanoparticles inside living cells Scientists work to prevent a nano-crisis […]