This post was co-authored by Arielle Mensch & Yi Cui
We recently received a very intriguing question from a 12-year old reader, Olivia, who asked, “How do scientists figure out the texture of cells?” This is a great question, and like most great questions, the answer is a bit complicated! Scientists have a variety of tools that we can use to measure the texture of cells, which we’ll explain a bit about in this post. But first, maybe you’re wondering, why do we even care about the texture of a cell…?

Well, looking at the texture or topography of a cell can give us insights into the health of the cell. The outermost part of the cell is its membrane, which we’ve written about previously as being a very important barrier between the inside and outside of the cell (for more, see our earlier posts How do Scientists Understand the Cell Membrane?, How Do Nanoparticles Stick to Bacteria? Or, How Are Cell Membranes Like Velcro? , and How do Nanoparticles Enter Cells?). The cell membrane plays a crucial role in regulating what enters and leaves a cell. For example, we can look at a cell membrane before and after exposure to a nanoparticle and see if the nanoparticle impacts the texture and topography of the cell – did defects or holes form, suggesting that the nanoparticle damaged the membrane? Did the cell bring the nanoparticle in (uptake) through its membrane? Did the nanoparticle get stuck on the cell surface?, In order to study these questions about what the cell surface looks like, we need tools that can study the texture of the cell.
Atomic Force Microscopy (AFM)
One crucial technique to study the topography of cells (and many other surfaces) is called atomic force microscopy (AFM). We’ve described the technique in detail previously here, but simply put, AFM uses a cantilever with a really, really small tip (nanometer-size) to trace the 3-dimensional topography of a sample. The scientist determines how much force to apply to the sample (a cell in our case) and the instrument works by maintaining this set amount of force. As the tip scans across the sample, a laser light aligned to the tip reflects off the tip onto a detector. As the tip moves up or down to maintain the set amount force, the detector senses any changes in height that the tip has undergone based on changes in height of the laser light. This gives us a very sensitive measure of the height of a sample. Figure 2 shows what this looks like in cartoon form.

AFM is great for measuring samples in different environments. It can work in air, vacuum, or even in liquid. The ability to work in liquid means that we can study the topography in cells when they are hydrated, which is how they are found naturally. Figure 3 shows some of my favorite AFM images that I’ve taken of cells (these cells come from the gills of trout).
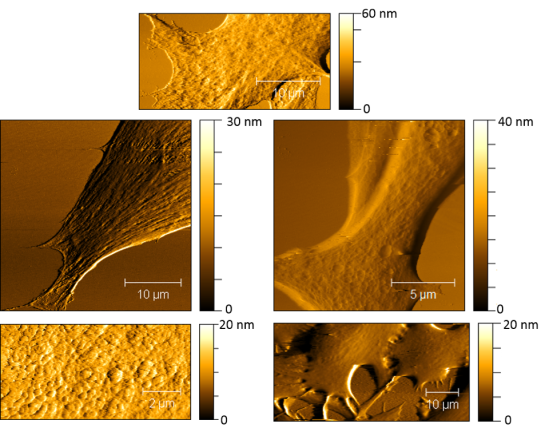
Much like a topographical map of a mountain range, an AFM image shows 3 dimensions: the lateral (x-y) dimensions, as well as the z (height) dimension. The different colors in the images correspond to different heights. The darker the color, the lower the height, and the lighter the color, the higher the feature. We can measure nanoscale differences in height for different features found on the cell surface! While we can observe different features, we cannot tell chemically what these features are (spoiler alert: fluorescence microscopy can combine with AFM to help us learn both! More about that below). What AFM is really great at and why we really love it in the CSN is that it can measure very small changes in the topography of cells. For example, if a nanoparticle lands on the cell or induces any holes or defects into the cell’s membrane we’ll be able to see those changes with AFM!
Scanning Electron Microscopy (SEM)
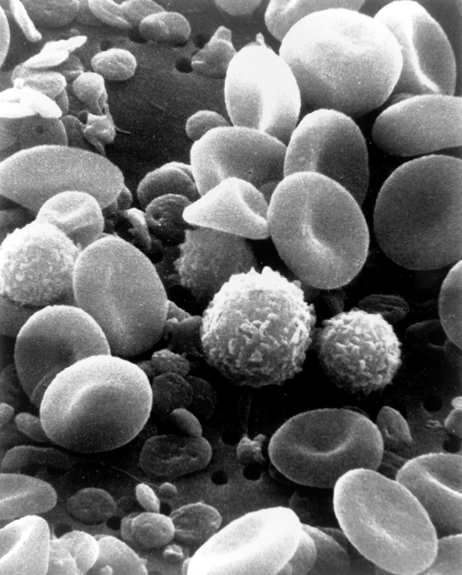
Scanning electron microscopy (SEM) is another tool that can be used to study the texture of a cell. Rather than a laser beam like AFM, SEM uses a focused beam of electrons to generate an image (check out this post for more info). With secondary electron detection SEM, scientists can get at texture or topography. This technique works by scanning a sample with a beam of electrons, which causes low energy “secondary” electrons to be ejected from excited atoms in the sample. These electrons are sent to a detector, which measures the amount of electrons coming from each region on the sample. Areas close to the detector appear brighter (more secondary electrons reach the detector), whereas areas farther away appear darker (less electrons reach the detector). This contrast in electron density gives rise to a picture of the texture of a sample. An example of visualizing blood cells using an SEM can be seen in Figure 5.
SEM usually relies on a vacuum environment in order to generate an image. Using an electron beam in an environment with lots of gas molecules floating around (like air) would rapidly spread and weaken the electron beam, since the electrons in the beam would bounce off those gas molecules. Furthermore, the sample for SEM needs to be conductive. A non-conductive sample will build up a charge of electrons when the beam scans over it and greatly decrease the focus and resolution of the image. Therefore, in order to image cells under the high vacuum required for SEM, they must first be dried and coated with a conductive material (such as gold or carbon – see this ladybug zoom in for an example). This method takes a cell out of its natural liquid environment and can end up misrepresenting the actual topography of the natural cell. However, scientists are working on ways to overcome this. A few options include:
- Cryo-SEM, where the SEM is operated at a very low temperature and the cells are preserved by a special form of freezing. This method allows the cell to remain hydrated, but still requires the sample be coated with a metal to be conductive.
- Environmental SEM (ESEM), which allows for wet and/or uncoated (no conductive coating required) samples to be imaged.
- The use of special capsules that seal the cells in liquid and are not disturbed by the vacuum.2,3
Fluorescence Microscopy
When it comes to determining the topographical landscape of a cell surface, AFM and SEM really excel in providing us stunning details inaccessible with traditional means. Nevertheless, as the mainstay of the imaging field, fluorescence microscopy also serves as a useful tool for probing the texture of cells, directly or indirectly. A fluorescence microscope makes use of materials that can absorb and emit light at particular ranges, and it collects this emitted light to generate an image (check out this this post to learn more about fluorescence).
One benefit to using fluorescence microscopy is its ability for target-specific imaging, which is more challenging for AFM or SEM. Target-specific imaging means that we can specifically mark a molecule of interest within the cell and use fluorescent probes to make that molecule show up bright when we excite it with a laser. After seeing a variety of cell membrane features as revealed by AFM and SEM, we may want to dig deeper and find out what those structures are made of and how they influence the functions of the cell. Target-specific imaging can answer these questions. By using specific molecules that bind to the feature of interest, fluorescence imaging can visualize the distribution and localization patterns of specific cell components, such as membrane receptors and cytoskeleton components (check out Snapshots of the Cytoskeleton for more).
Since scientists started using super-resolution fluorescence techniques in 2006, fluorescence microscopy is rapidly catching up to the imaging resolution of AFM and thus can answer a lot of questions about why a cell appears the way it does. For instance, as shown in Figure 6, the cytoskeleton of a cell is labeled with a tubulin-specific antibody (tubulin is a protein found in the cytoskeleton). The super-resolution fluorescence technique called STORM can push the imaging resolution to about 10 nm (>20-fold improvement over conventional optical microscopy methods), which can greatly advance our understanding of cell shape and movement. A more encouraging fact is that now it is possible to combine super-resolution fluorescence microscopy and AFM! (Figure 7)4 Therefore, scientists are not only able to determine what the surface of a cell looks like, but they can also learn what the underlying components are.

Lattice light-sheet microscopy
But wait, fluorescence microscopy wants to contribute more. Target-specific? Super-resolution? Three-dimensional? Live-cell? Hey, let’s do all of them at one time! As we know, every cell is a living system and thus highly dynamic. So is its surface texture and shape. Normally, cellular activities are performed at the millisecond-to-second levels, which is often too fast for AFM and SEM to keep up with. The latest high-end fluorescence microscopy technique, called lattice light-sheet microscopy (developed by 2014 Nobel Laurate Dr. Eric Betzig5), provides another groundbreaking tool for scientists to research single live cells at unprecedented resolutions. With this technical breakthrough, for the first time scientists have the ability to clearly capture activities related to cell membranes, such as the fast-swing movement of filopodia (Movie 1), cells crawling (Movie 2) and dynamic inter-cell contact (Movie 3). With that being said, the scientific odyssey of revisiting cell biology is just beginning as more labs are adopting new platforms and methods for studying cells.
Movie 1. Fast-swing movement of filopodia on the surface of a HeLa cell (filopodia are tiny membrane projections facilitating cells to sense, migrate and interact). (Movie by Betzig Lab, HHMI/Janelia Research Campus; 10/24/14 issue of the journal Science)
Movie 2. Membrane dynamics of a HL-60 neutrophil cell migrating on glass. (movie by Betzig Lab, HHMI/Janelia Research Campus, Mullins Lab, HHMI/University of California, San Francisco; 10/24/14 issue of the journal Science)
Movie 3. Membrane interaction of an immune cell (red) sensing and attacking a potentially pathogenic cell (blue). (Movie by Betzig Lab, HHMI/Janelia Research Campus, Lippincott-Schwartz Lab, National Institutes of Health; 10/24/14 issue of the journal Science)
In terms of imaging cells to determine their texture, each of the three techniques we have described comes with its own challenges with sample preparation. For AFM, it’s crucial to minimize the force applied to the cell to ensure that the scanning tip doesn’t damage the cells. Furthermore, the cells must be strongly stuck to the substrate. Otherwise, it is possible to drag the cell around with the tip, which I’m definitely guilty of doing on more than one occasion. For SEM, the necessity to work under vacuum in most cases requires either drying or freezing and then coating of the sample with a conductive material. This can impact the surface texture and induce imaging artifacts. Fluorescence microscopy requires additional staining steps to label the targets of interest in fixed cells, which heavily relies on there being a high quality stain for your target available. For live-cell fluorescence imaging, the predominant way is by introducing a fluorescent version of target proteins, which requires special treatment of the cells before imaging.
| Image acquisition time | Max scan area | Sample environment | Image artifact potential | Resolution | |
| Atomic Force Microscopy (AFM) | ~ 20 min for cells | <90 µm for one image | Air, liquid, vacuum; can image cells live or fixed | Tip contamination and sample damage | ~10 nm lateral; <0.1 nm z height |
| Scanning Electron Microscopy (SEM) | < 1 min | mm | Vacuum; sample needs to be conductive | Drying can induce artifacts | ~10 nm lateral |
| Fluorescence Microscopy | < 1 min | mm | Air, liquid; can image cells live or fixed | Low | can reach ~10 nm lateral |
Table 1. Comparison of the three techniques discussed here. This information is based on our experiences in the CSN.
So which of the three techniques discussed is the best technique to determine the texture of a cell? Well, all three techniques have their advantages and disadvantages as shown in Table 1. So in terms of determining which technique to use to learn the texture of the cell, it really depends on the question you’re trying to answer and the instrumentation available! Scientists around the world are working hard using all three techniques (sometimes in combination) to help learn about the texture of cells.
References
- Xu, K., Babcock, H., & Zhuang, X. Dual-objective STORM reveals three-dimensional filament organization in the actin cytoskeleton. Nature Methods, 2012. 9:2. Doi: 1038/nmeth.1841
- QuantomiX: http://www.wetsem.com/
- Thiberge, S., Nechushtan, A., Sprinzak, D., Gileadi, O., Behar, V., Zik, O., . . . Kornberg, R. Scanning Electron Microscopy of Cells and Tissues under Fully Hydrated Conditions. Proceedings of the National Academy of Sciences of the United States of America, 2004,101(10), 3346-3351. https://www-jstor-org.ezp2.lib.umn.edu/stable/3371481
- Hecht, E., Thompson,K., Frick, M., Wittekindt, O., Dietl, P., Mizaikoff, B., & Kranz. C.Combined Atomic Force Microscopy–Fluorescence Microscopy: Analyzing Exocytosis in Alveolar Type II Cells. Analytical Chemistry 2012 84 (13), 5716-5722. DOI: 1021/ac300775j
- NobelPrize.org. Eric Betzig Facts. Retrieved from https://www.nobelprize.org/nobel_prizes/chemistry/laureates/2014/betzig-facts.html

